data analysis, interpretation, and presentation
approach
depends on data
quantitative
qualitative
mixed methods
translating raw data
interviews
translating raw data
interviews
questionnaires
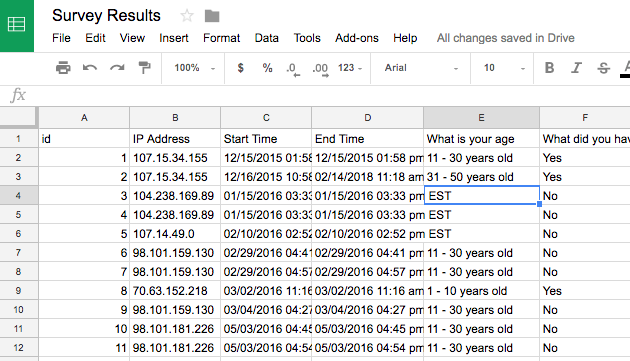
translating raw data
interviews
questionnaires
observations
analysis
begins with initial reactions or observations
identify patterns
calculating values
data cleansing: check for errors
interpretation
parallel with analysis
results interpreted different ways
make sure data supports conclusion
avoid biases
avoid over claiming
presentation
different methods, depends on goals
affects interpretation
quantitative analysis
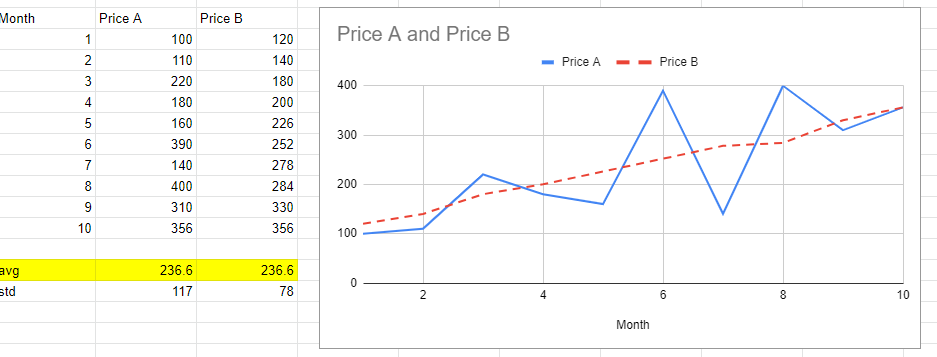
statistical analysis
averages
percentages
averages
mean
median
mode
individual differences
task times: 45, 50, 55, 55, 60, 65
mean: 55
median: 55
mode: 55
task times: 45, 50, 55, 55, 60, 300
mean: 94.2
median: 55
mode: 55
task times: 10, 10, 50, 55, 60, 300
mean: 80.8
median: 52.5
mode: 10
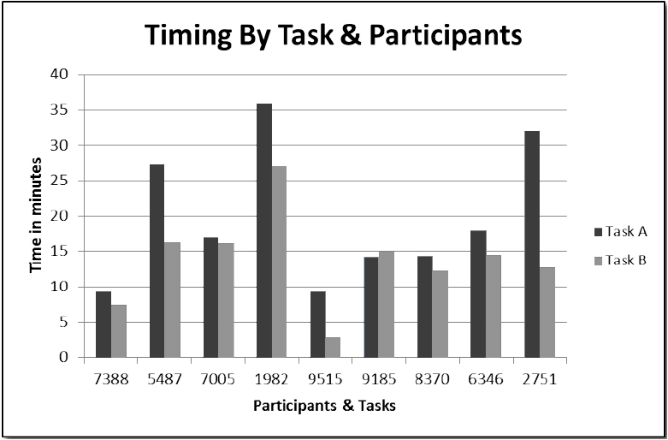
data format
table: rows and columns
how to represent responses and measures
participants as rows
responses: single or multiple
bar charts
scatter plots

pie charts
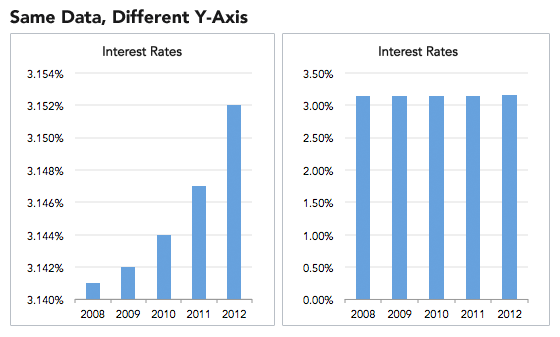
presenting percentages
almost always better ways
comparison difficult when percentages similar
include percentages as text
provide overview with other representations

qualitative analysis
initial approach
gain overall understanding
look for interesting features
highlight common, record surprises
tools
transcription: oTranscribe, Otter.ai, Trint
coding and analysis: Dedoose, Atlas.ai, Nvivo
approaches
identifying themes
categorizing data
analyzing critical incidents
identifying themes
thematic analysis
inductive
identify, analyze, and report patterns
themes represent important, relevant, or unexpected patterns
steps
iterative
open coding: initial pass
axial coding: themes across participants, connections, categories
selective coding: validate relationships, consistency, themes
affinity diagrams
organize ideas and insights into hierarchy
groupings emerge through data
categorizing data
categorizing data
deductive vs inductive
study goals
deductive: categorization schemes
inductive: arise from analysis
- Interface Problems
- Verbalizations show evidence of dissatisfaction about an aspect of the interface.
- Verbalizations show evidence of confusion/uncertainty about an aspect of the interface. ...
- Content Problems
- Verbalizations show evidence of dissatisfaction about aspects of the content of the electronic text. ...